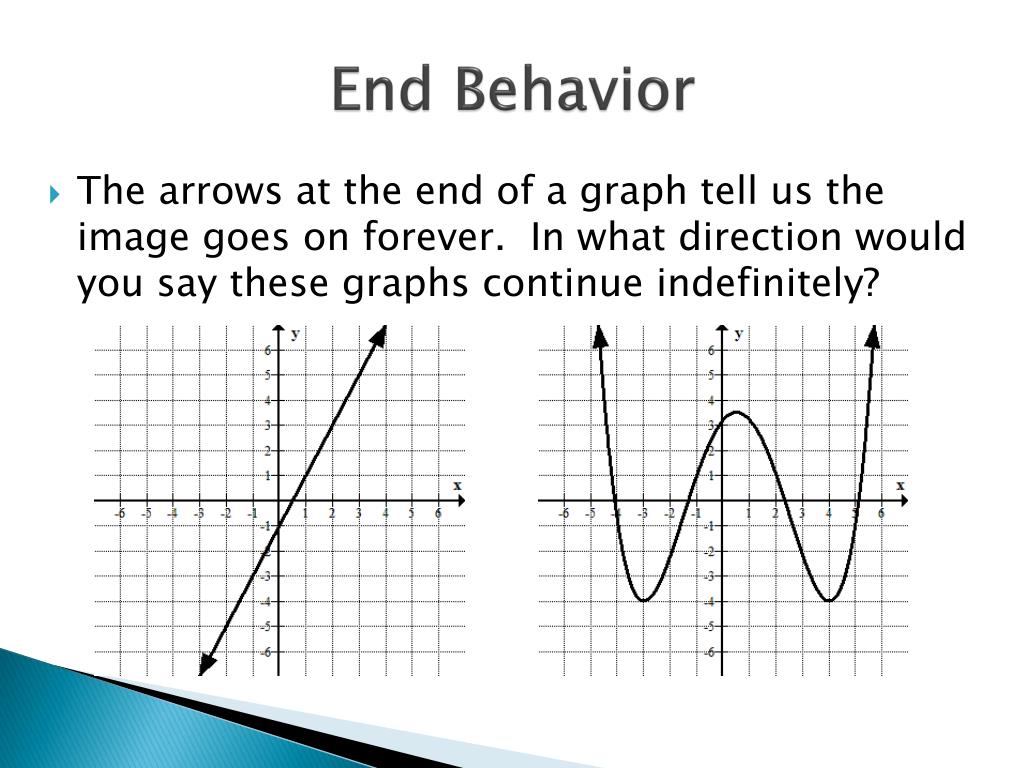
Ever stared at a graph and wondered what happens to it way, way out there, beyond what you can easily see? That's where the magic of end behavior comes in, and surprisingly, it's a concept that can be both fun and incredibly useful! Think of it like predicting where a roller coaster track is heading even if you can only see the first few hills. And guess what? There are handy tools, like an end behavior calculator, that make exploring this even easier!
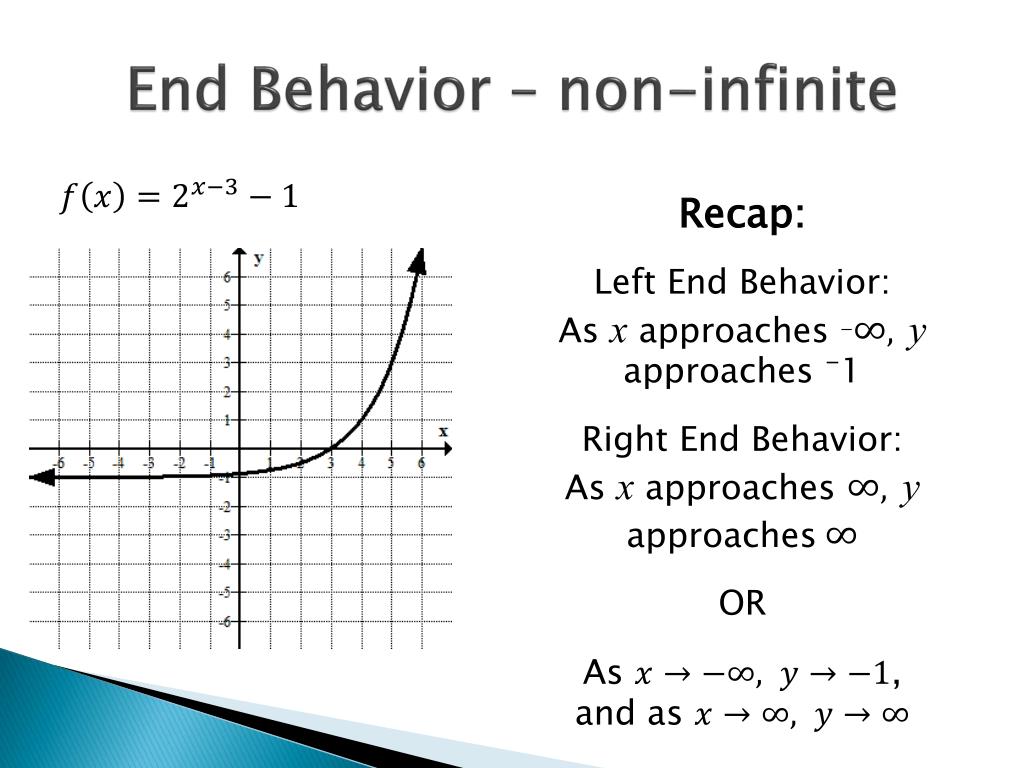
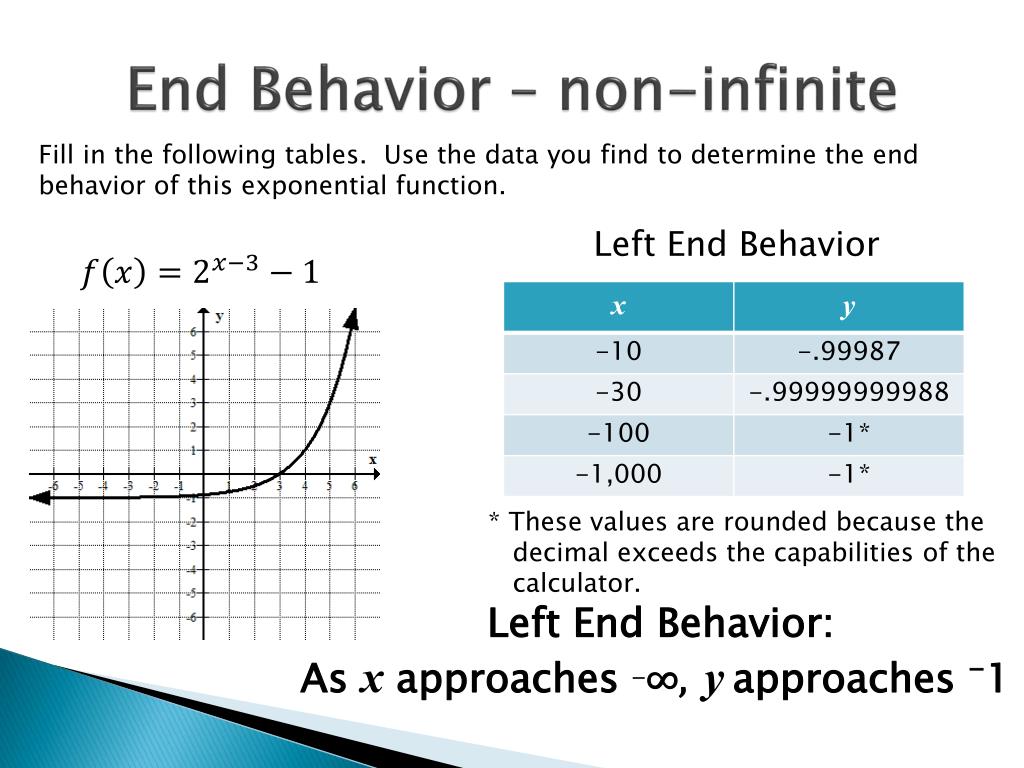
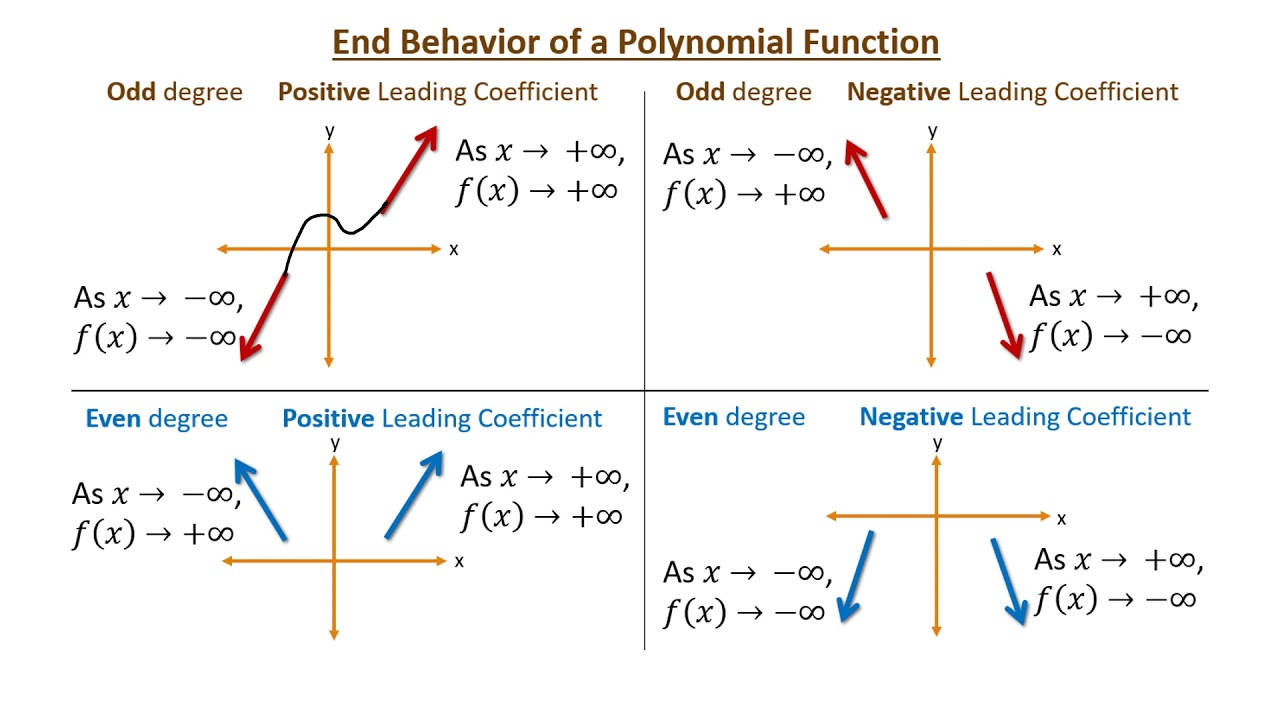
So, what exactly is end behavior? In simple terms, it's describing what happens to the function's output (the 'y' values) as the input (the 'x' values) gets extremely large, either in the positive direction (approaching infinity) or the negative direction (approaching negative infinity). It's like asking, "Does this graph shoot up to the sky forever, plummet down into the abyss, or level off somewhere?"
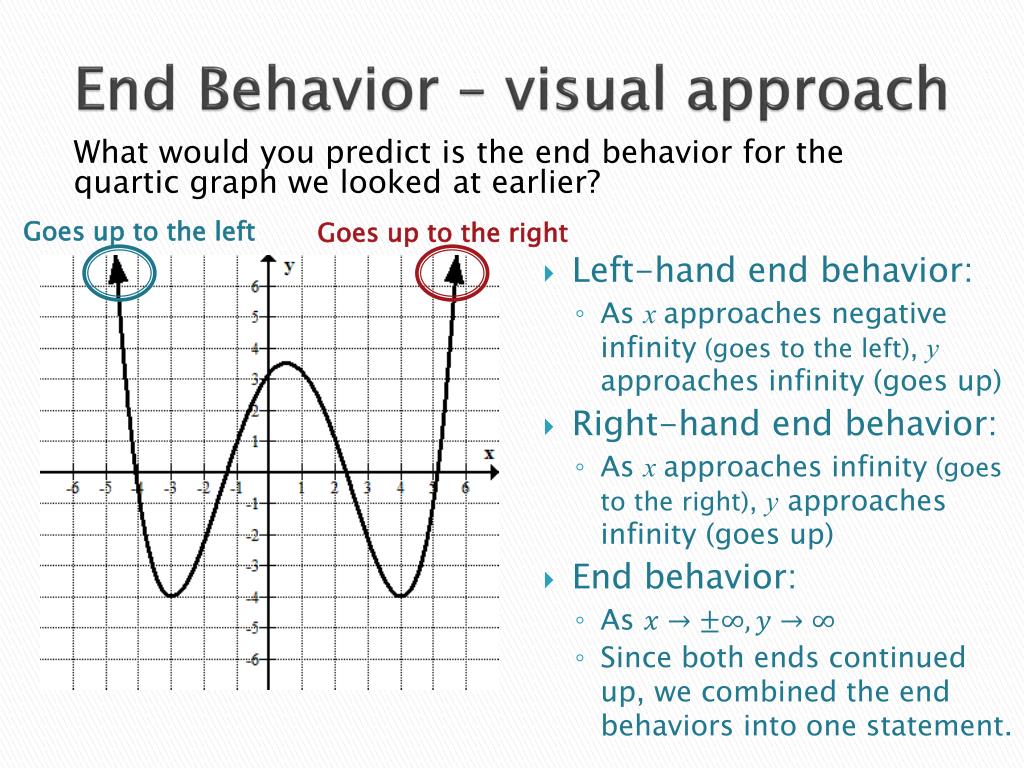
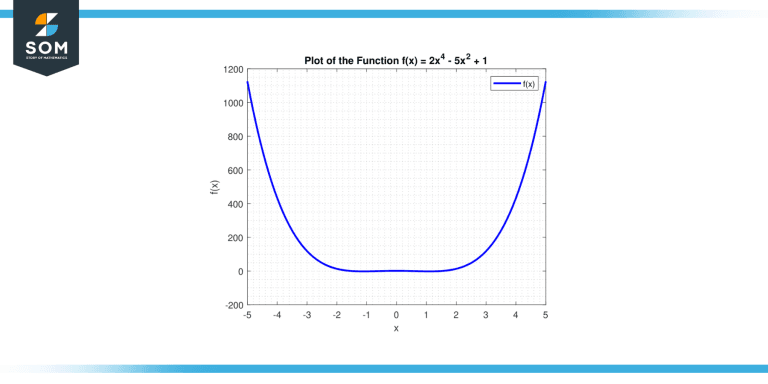
Why should you care? Well, it's a fundamental concept in understanding how functions behave, and it pops up in all sorts of places. For beginners just dipping their toes into math, it's a fantastic way to build intuition about graphs. It demystifies complex equations by focusing on the big picture. For families looking for a cool, educational activity, it can turn graph-reading into a detective game. Imagine exploring the end behavior of different polynomial functions (those with exponents!) and seeing how the highest power dictates the overall direction. It's a great way to make math more tangible and less abstract.
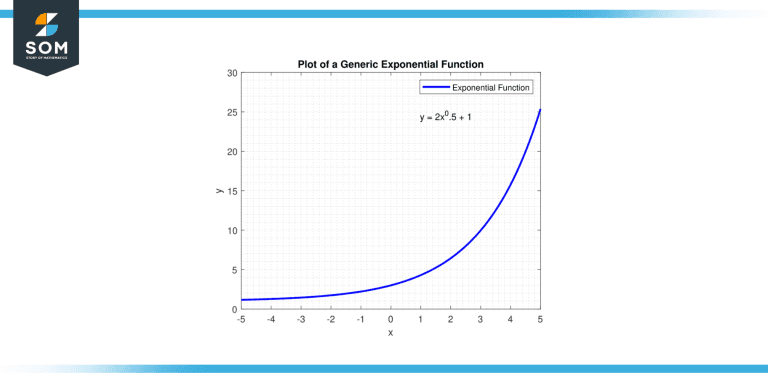
Even hobbyists might find this useful. If you're interested in modeling real-world phenomena – like the trajectory of a projectile or the growth of a population – understanding end behavior helps you predict long-term trends. An end behavior calculator can be a quick way to check your assumptions or explore different scenarios without getting bogged down in complex calculations.
Let's look at some simple examples. For a function like $f(x) = x^2$, as 'x' gets super big (positive or negative), $f(x)$ gets even bigger and bigger, so it heads towards positive infinity on both sides. Easy peasy! For $f(x) = -x^3$, as 'x' heads towards positive infinity, $f(x)$ heads towards negative infinity, and as 'x' heads towards negative infinity, $f(x)$ heads towards positive infinity. It's like a mirrored zigzag! Many calculators can help you find these patterns by simply inputting the function.

Getting started is super simple. Most online graphing calculators or dedicated math software have features to help you. You can often just type in your function, and the calculator will show you the graph. Then, you can use its tools to "zoom out" and observe the trend, or it might even have a specific "end behavior" finder. Some calculators might ask you to describe the behavior using words like "approaches infinity" or "approaches negative infinity," or they might use mathematical notation like $\lim_{x \to \infty} f(x) = \infty$. Don't be intimidated by the symbols; they just represent the ideas we've discussed!
Ultimately, exploring end behavior with the help of a calculator is about developing a deeper appreciation for the dynamic nature of functions. It's a journey from specific points to overarching trends, and it’s a surprisingly satisfying and insightful experience.