Okay, so let's chat about something that sounds super science-y but is actually kind of a hoot: the phase diagram for carbon dioxide. Yeah, I know, CO2. You're thinking dry ice, right? Well, you're not wrong, but there's a whole lot more to this invisible gas than you might think. It’s like a secret map of what CO2 gets up to under different conditions.
Think of a phase diagram as a recipe book for a substance. Instead of ingredients, it uses temperature and pressure. And instead of cookies, you get different states: solid, liquid, or gas. For CO2, this recipe book is particularly interesting. It’s not your average cake baking, people. This is high drama in the molecular world.
So, what's the big deal? Well, CO2 doesn't behave like water. You know how you can boil water and it turns to steam? Or freeze it and it becomes ice? CO2 does its own thing. And that’s where the fun begins!
Dry Ice is Just the Beginning
You've probably encountered dry ice. It’s that spooky, smoky stuff at Halloween parties. It looks solid, right? But if you leave it out, it doesn't melt into a puddle. Nope. It just… disappears. This is called sublimation. It goes straight from solid to gas. Poof! Like a magic trick, but with science.
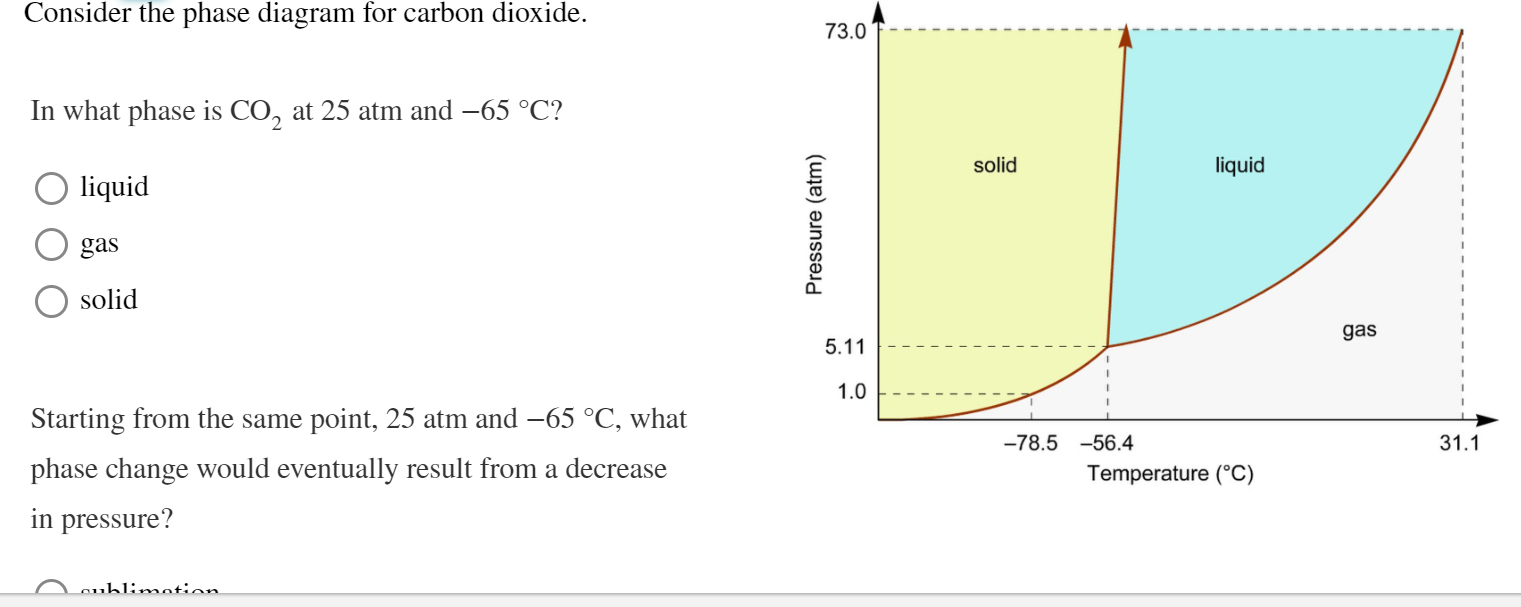
This is a key feature of CO2’s phase diagram. At regular atmospheric pressure, the solid form (dry ice) skips the liquid phase entirely. It’s like it’s too impatient to be a puddle. It's a solid, then it's a gas. No in-between for this guy.
Imagine if water did that. You'd have your ice cubes, and then poof – instant steam. No water to drink. That would be… inconvenient. But for CO2, it’s just how it rolls. And that makes dry ice super useful for keeping things cold without any messy melting.
The "Triple Point" is Where the Party's At
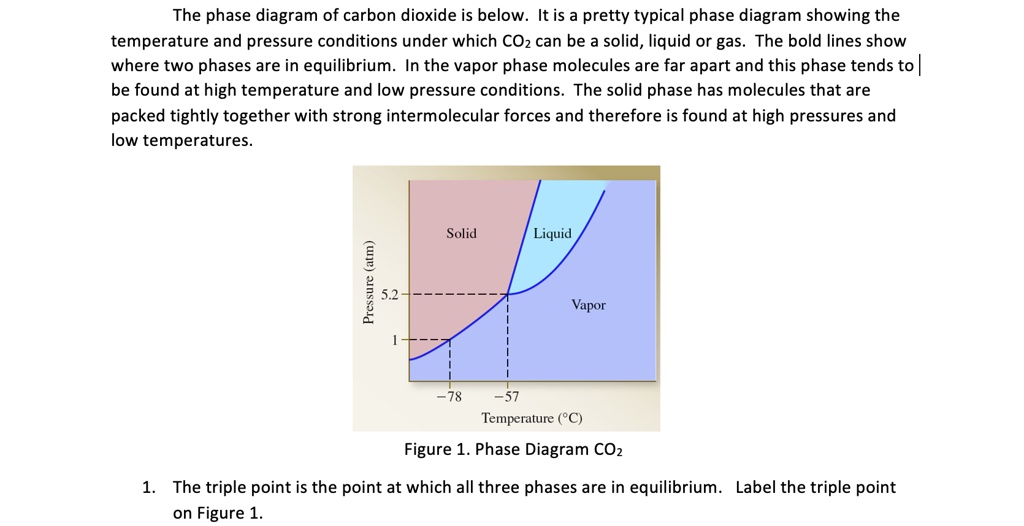
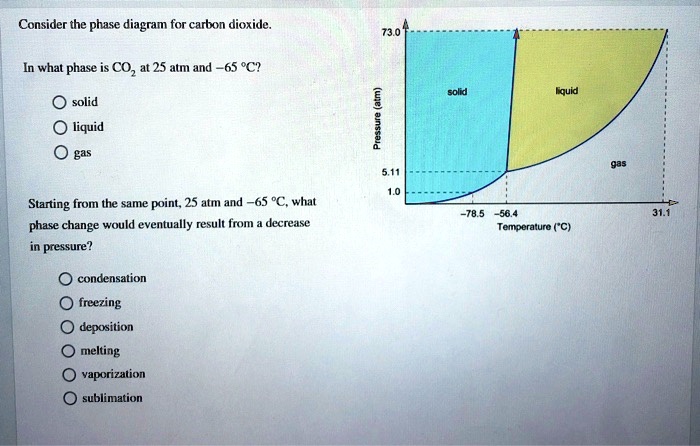
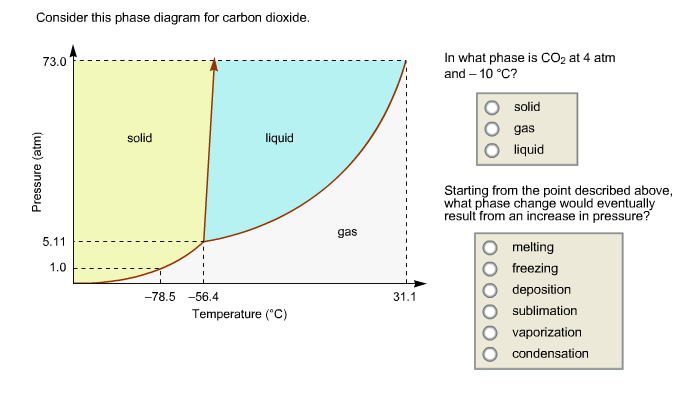
Every substance has something called a triple point. This is the exact spot on the phase diagram where all three phases – solid, liquid, and gas – can exist together in equilibrium. It’s like a tiny, molecular tea party where everyone’s getting along. For CO2, this triple point is at a pretty specific temperature and pressure. It's about -56.6 degrees Celsius and 5.18 atmospheres of pressure. Don't ask me to remember that off the top of my head, but it's a thing!
Why is this cool? Because if you can get your CO2 to its triple point, you can have solid dry ice, liquid CO2, and gaseous CO2 all chilling out together. It's a state of perfect balance. And scientists love finding these perfect balance points.
Think about it. You’ve got your solid, your liquid, and your gas, all existing simultaneously. It’s like the universe saying, “Here, have all three!” It's a bit like finding a unicorn, but with molecules. And way less glitter.
The "Critical Point" is Like CO2's Limit
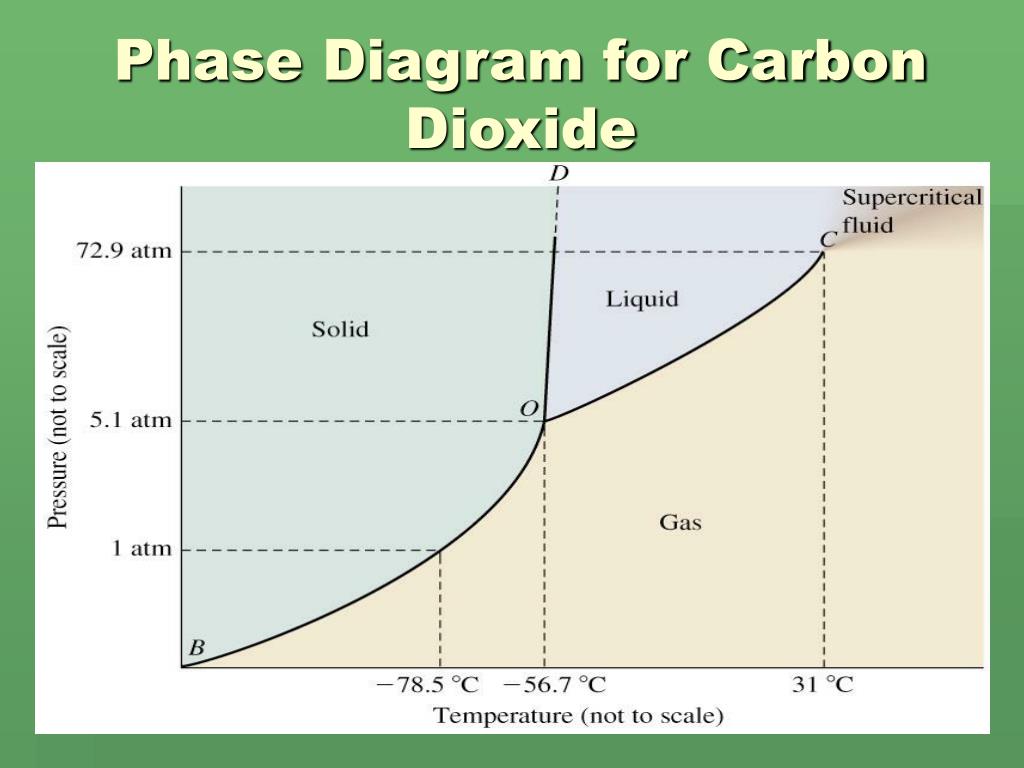
Then there’s the critical point. This is another super important spot on the diagram. Above a certain temperature and pressure (the critical temperature and critical pressure), CO2 becomes what's called a supercritical fluid. This is where things get really weird and wonderful.
What's a supercritical fluid? Imagine a substance that's sort of like a liquid and sort of like a gas at the same time. It has the density of a liquid, so it can dissolve things like a liquid. But it also has the viscosity of a gas, so it can flow through things like a gas. It’s like a shape-shifter!
For CO2, this critical point is around 31 degrees Celsius and 72.8 atmospheres. So, if you heat CO2 up past 31°C and squeeze it really hard, it enters this strange supercritical state. It’s neither fully liquid nor fully gas, but something in between.
This supercritical CO2 is incredibly useful! It can be used to extract things, like caffeine from coffee beans (hello, decaf!). It’s also a greener alternative to using harsh organic solvents in many industrial processes. It’s like a secret weapon for clean chemistry. Who knew our favorite greenhouse gas could be so… helpful?
Why Should You Care About CO2's Phase Diagram?
Okay, okay, I can hear you. "But why should I care about a bunch of lines on a graph?" Well, because it explains why things happen! It explains why dry ice is dry. It explains why you can't just store CO2 in a regular bottle at room temperature and expect it to stay liquid (unless you're talking about those little canisters for whipped cream, which are a whole other story!).
It also helps us understand how CO2 behaves in different environments. Think about the Earth's atmosphere. It’s a big, messy place with lots of different temperatures and pressures. The phase diagram helps scientists model how CO2 might exist and move around in that complex system.
And it’s just plain fascinating! The idea that a substance can have such distinct personalities depending on how you treat it is pretty cool. It's a reminder that even the most familiar things can have hidden depths and surprising behaviors.
The "Unusual" Nature of CO2
Here’s a quirky fact: CO2’s phase diagram is actually considered a bit unusual compared to many other common substances. Specifically, its triple point is at a temperature that's well below typical atmospheric conditions. This is why sublimation is so common for CO2 at everyday pressures.

Imagine if water's triple point was at -100 degrees Celsius. We'd be dealing with a very different world! We'd have ice everywhere, and turning it into liquid water would require a lot more effort. CO2’s behavior is a bit of a rebel.
It’s this very sublimation that makes dry ice so convenient for transport and cooling. No melting means no drips, no spoilage. It’s a clean and efficient way to keep things frosty.
So next time you see dry ice, or think about the invisible gas around us, remember its phase diagram. It’s a little map that tells a big story about temperature, pressure, and the weird and wonderful ways matter can exist. It’s a whole world of science, just waiting to be explored, one molecule at a time.
And hey, if nothing else, it's a great conversation starter. "Did you know CO2 can be a supercritical fluid?" Bam. Instant intrigue. You’re welcome.